BUY/SELL + ADVANCE DECLINEThis script is a custom trading view indicator that helps to identify potential buy and sell signals based on the RSI (Relative Strength Index) and SMA (Simple Moving Average) indicators. The script also identifies potential reversals using a combination of RSI and price action. It plots buy, sell, and reversal signals on the chart along with an SMA line. Additionally, it provides alerts based on the buy, sell, and reversal conditions.
Changes made to the original script:
Fixed the undeclared identifier 'c' error by calculating the difference between the current closing price and the previous closing price: c = close - close .
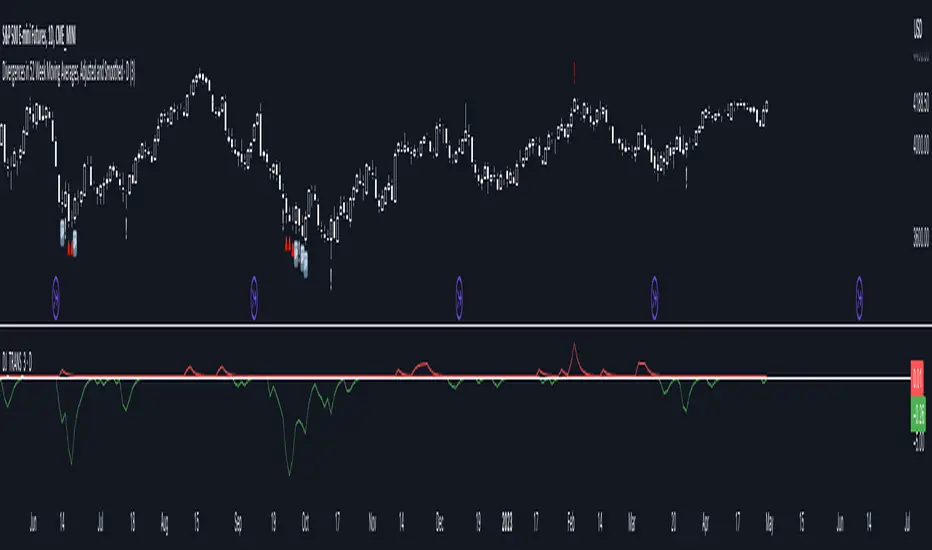
Added an "ADD Value Floating Label" to the chart. The label shows the difference between the current and previous closing prices (ADD value) along with a "Bullish" or "Bearish" indicator based on the value of 'c'. The label is positioned at the top right of the visible chart area and remains static.
Here's a summary of the major components of the script:
Input settings: Define the input parameters for RSI and SMA.
Calculation of RSI and SMA: Compute the RSI and SMA values based on the input parameters.
Color definitions: Define colors for different conditions and levels.
Condition definitions: Define various conditions for buy, sell, reversal, and other criteria.
Buy and sell conditions: Determine buy and sell signals based on RSI, SMA, and price action.
Reversal conditions: Identify potential reversals using RSI and price action.
Plot signals: Display buy, sell, and reversal signals on the chart.
Bar colors: Color the bars based on the identified signals.
Plot SMA: Display the SMA line on the chart.
Alert conditions: Set up alerts for buy, sell, and reversal conditions.
ADD Value Floating Label: Add a label to the chart showing the ADD value and a "Bullish" or "Bearish" indicator.
אינדיקטור Pine Script®